
Google has rolled out a benchmarking feature for Google Analytics 4 (GA4), allowing users to compare their performance with other businesses in their industry.
Shedding light on the new feature in a blog, Google wrote, “Google Analytics offers benchmarks based on cohorts of businesses that are similar to yours called peer groups. These peer groups are based on signals like your industry vertical and other salient details about your business.”
To ensure the relative position of a business is based on the most current industry data, benchmarks are refreshed typically every 24 hours.
What are Peer Groups?
Peer groups in Google Analytics 4 lets businesses benchmark their performance. It offers industry-specific data to help businesses compare their performance against similar companies.
These peer groups are carefully constructed based on relevant metrics such as:
- Industry vertical
- Company size
- Geographic location
With a quantitative comparison against industry averages or specific peer groups, benchmarks help brands identify their strengths, weaknesses, and opportunities for improvement.
Here’s how businesses can use this feature:
- Gain insights into industry trends
- Identify best practices
- Make data-driven decisions to optimise their operations
Google Analytics benchmarks are dynamic and updated regularly (typically every 24 hours) to ensure that comparisons are based on the most current industry data. This real-time nature of benchmarks provides businesses with a continuous view of their performance relative to their peers.
Prerequisites for Google Analytics Benchmarking
To access the valuable insights provided by Google Analytics benchmarking, your property must meet a specific requirement:
Modelling Contributions & Business Insights: This setting must be enabled within your Google Analytics account.
You can locate this setting in the Admin section, under Account Settings.
Once this setting is activated, you’ll unlock the ability to compare your business’s performance against industry benchmarks, gaining valuable insights to inform your decision-making and strategic planning.
Data Privacy and Quality in Google Analytics Benchmarking
Google Analytics prioritises data privacy to keep your information safe and makes sure it’s accurate. Your data is encrypted and protected to maintain its confidentiality. They also combine data from different businesses to keep individual companies private..
To make sure the comparisons are fair, Google Analytics sets minimum standards for the number of businesses in each group and the amount of data they produce. This helps to create a representative sample of the industry. To be included in a peer group and contribute to benchmarking, properties must have enough users and data.
These measures ensure that you compare your performance against high-quality industry standards while maintaining the confidentiality of your sensitive data.
How To Access Benchmarking Metrics
To access benchmarking data:
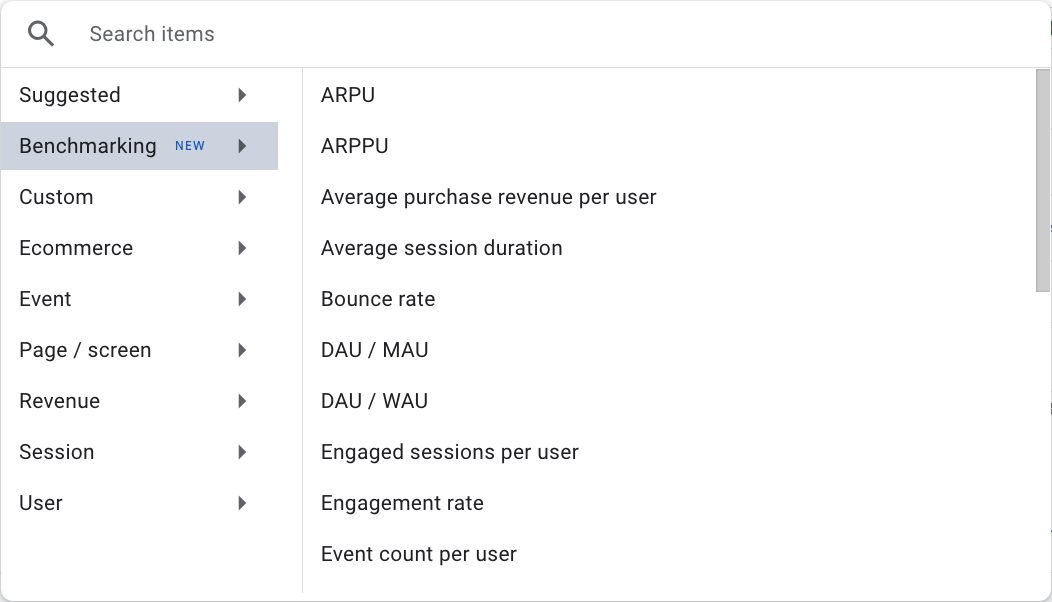
- In the overview card on the Home page, select the metric you want to change.
- Expand the Benchmarking category.
- Select one of these metrics for which you want to view benchmarking data:
- Acquisition
- New user rate
- Engagement
- Average engagement time per session
- Average engagement time per user
- Average session duration
- Engagement rate
- Engaged sessions per user
- Event count per user
- Events per session
- Session key event rate
- Sessions per user
- User key event rate
- Views per session
- Views per user
- Retention
- Bounce rate
- Daily active users / Monthly active users (DAU / MAU)
- Daily active users / Weekly active users (DAU / WAU)
- Weekly active users / Monthly active users (WAU / MAU)
- Monetisation
- Add to carts per user
- Average revenue per user (ARPU)
- Average revenue per paying user (ARPPU)
- Average purchase revenue per user
- Checkouts per user
- First-time purchaser rate (FTP rate)
- First-time purchasers per new user
- Paying monthly active users / Daily active users (PMAU / DAU)
- Paying weekly active users / Daily active users (PWAU / DAU)
- Total ad revenue per user
- Transactions per purchaser
- Transactions per user
- Acquisition
How To Enable Benchmarking Data in Google Analytics
Make sure the benchmarking data is enabled for a specific metric to access the benchmarking insights:
- Verification: If benchmarking data is enabled for the currently selected metric, you’ll notice the “On” label displayed next to the benchmarking badge located in the top right corner of the overview card.
- Activation or Deactivation: To toggle benchmarking data on or off, simply click the benchmarking badge. When benchmarking is enabled, the benchmark value will be prominently displayed in the overview card.
Insights on how your business’s performance compares to industry averages and peer groups helps you make data-driven decisions and identify areas for improvement.
Understanding Benchmark Data in the Overview Card
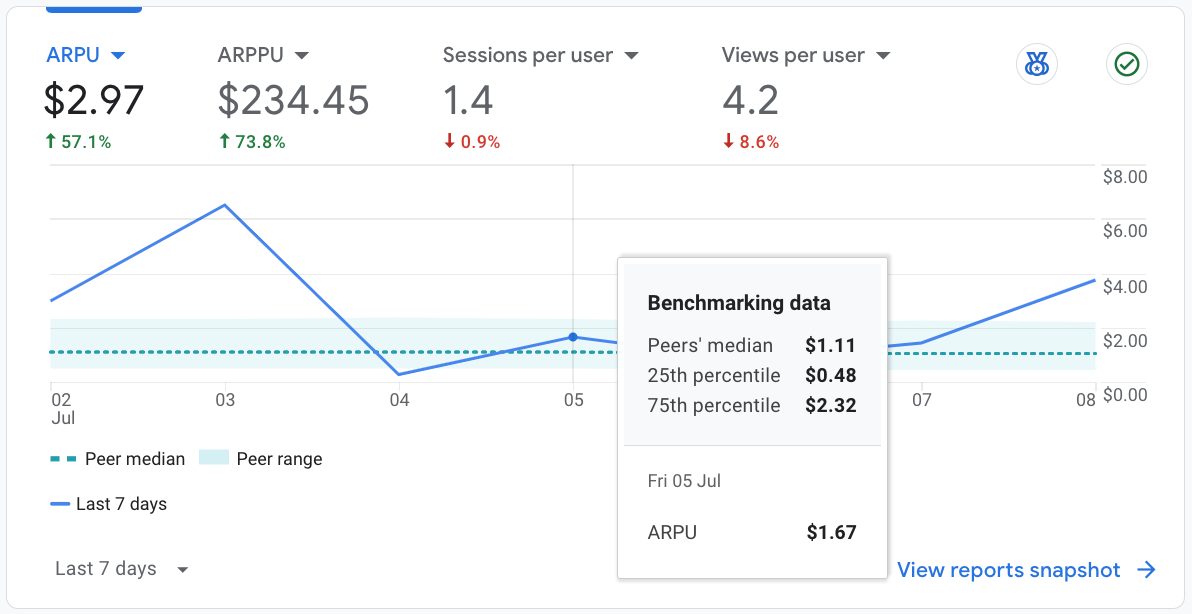
When you activate benchmarking data, the overview card provides a visual representation of your performance:
- Your property’s trendline (solid line): Your business’s performance over time.
- Median in your peer group (middle line): The median performance of businesses in your peer group.
- Range in your peer group (shaded area): The range of performance within your peer group.
- Benchmark Range: The benchmark range in Google Analytics is within the 25th and 75th percentile levels. It focuses on the performance of businesses in your industry to help you make more informed decisions about your strategy and performance.
- Interactive Features: To gain deeper insights, you can hover over your property’s trendline. This will provide additional details, such as the specific value of your metric at any given point in time.
How To Change Your Peer Group
A peer group is a carefully selected group of businesses that share similar characteristics with yours, such as industry vertical, company size, and geographic location.
By comparing your performance against a relevant peer group, you can obtain more accurate and meaningful insights.
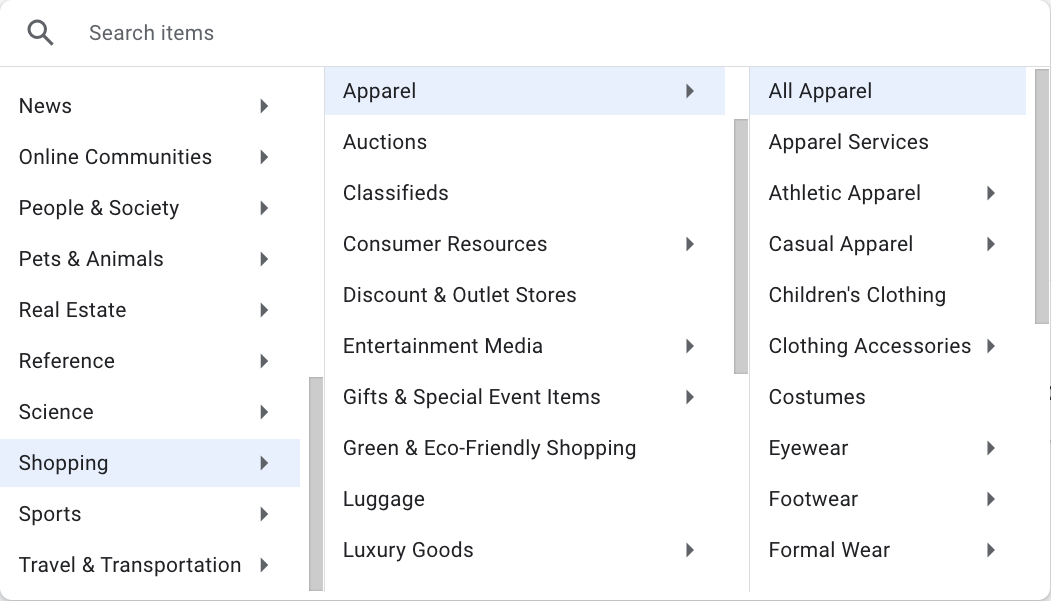
- Selecting a Peer Group: To choose the most appropriate peer group, consider your primary industry. For instance, if your business operates in the apparel sector, you would select the Shopping > Apparel peer group.
- Changing Your Peer Group: To modify your peer group, locate the “Benchmarking peer group” section within the benchmarking data badge. Click the peer group button to access a list of available options. Select the one that best aligns with your business.
- Default Peer Group: Your initial peer group is automatically assigned based on the Industry Category you specified during the property setup process, along with other relevant attributes like your default URL and the app ID associated with your property’s data streams. This default grouping provides a starting point for your benchmarking analysis.
You can choose a peer group from one of these categories:
- Arts & Entertainment
- Autos & Vehicles
- Beauty & Fitness
- Books & Literature
- Business & Industrial
- Computers & Electronics
- Finance
- Food & Drink
- Games
- Health
- Hobbies & Leisure
- Home & Garden
- Internet & Telecom
- Jobs & Education
- Law & Government
- News
- Online Communities
- People & Society
- Pets & Animals
- Real Estate
- Reference
- Science
- Shopping
- Sports
- Travel & Transportation
Note that you can select sub categories within each of the top level categories listed above. For example, Shopping > Apparel > Footwear > Athletic shoes.
Benchmarking Scenarios: Actionable Insights
Benchmarking data offers valuable insights into your business’s performance relative to industry peers.
Let’s examine a few scenarios where benchmarking can be applied:
User Acquisition
Peer Group: Shopping > Apparel
- Scenario: A consistently low ‘New User Rate’ compared to the 25th percentile of your peer group.
- Insight: You’re acquiring new users at a lower rate than similar businesses.
- Action: Invest in user acquisition strategies, such as targeted advertising, social media campaigns, or content marketing.
User Engagement
Peer Group: Arts & Entertainment
- Scenario: A significantly higher ‘Average Engagement Time per Session’ compared to the 75th percentile.
- Insight: Users are spending more time on your site than most peers.
- Action: Leverage this engagement with strategies to increase conversions, like strategically placed calls-to-action or personalised recommendations.
User Retention
Peer Group: Travel & Transportation
- Scenario: A higher ‘Bounce Rate’ compared to the median of your peer group.
- Insight: Users are leaving your site after viewing only one page.
- Action: Investigate reasons for the high bounce rate, such as poor user experience, irrelevant content, or suboptimal landing pages.
Monetisation:
Peer Group: Food & Drink
- Scenario: A lower ‘ARPU’ compared to the 25th percentile.
- Insight: You’re generating less revenue per user than most peers.
- Action: Explore strategies to increase ARPU, such as upselling, cross-selling, loyalty programs, or personalised offers.
Remember, these are just a few examples. Benchmarking data can be applied to various metrics to inform your business strategies and drive growth.
By understanding your relative performance, you can identify areas of strength and opportunities for improvement to achieve your business goals.
Need a fresh perspective? Let’s talk.
At 360 OM, we specialise in helping businesses take their marketing efforts to the next level. Our team stays on top of industry trends, uses data-informed decisions to maximise your ROI, and provides full transparency through comprehensive reports.


.png)


